

Historically when we think of supply chains, we envision routine and predictable procedures that bring product from point A to point B. It’s a perfect and dependable cycle that never ends. Until now. The impact of COVID-19 on supply chains caused unprecedented shutdowns resulting in a break in logistics and supply chain management, such as creating bottlenecks in global supplies.
Freight logjams and shortages of everything from garbage truck parts to hydraulic components are forcing manufacturers to come up with alternatives in shipping, overland freight and even where to source materials. Cost of materials, particularly metals in the industrial sector, have been rising this year due to a slow manufacturing recovery following last year’s lockdowns. In July, exasperated terminal operators in the ports of Los Angeles and Long Beach (otherwise known as the San Pedro Bay port complex) reported they are experiencing vessel bunching, chassis shortages, and excessive container dwell times. Vessels have begun stacking up outside some of the busiest ports around the world. As an example, on the 27th of July alone there were 26 container ships waiting at anchor for berthing space at the San Pedro Bay port terminals. Putting this into perspective, an average cargo ship is approximately 700 feet long and carries about 1,000 40-foot containers, each accommodating around 25 to 30 tons of goods. That equates to a ship’s total carrying capacity of about 25,000 tons. So, on July 27th at Los Angeles and Long Beach there was about 650,000 tons of goods floating around in the ocean just waiting to ‘park’.
It’s important to understand the impact of COVID-19 on supply chains. The San Pedro Bay port complex is ranked the #1 container port and busiest seaport in the Western Hemisphere, and perhaps the most vital to North American imports, processing over 10 million container units per year. For example, exports from China are bound for this port, where goods are then trucked to distribution centers or transferred to intermodal rail for destinations in the Midwest. In addition, this has also become a problem for exporters due to container shortages and delays which have spread to America’s agricultural exports.
As we approach the fourth quarter, companies from SMBs to fortune 500s are still experiencing supply chain and logistics bottlenecks. For instance:
- The world’s second largest manufacturer of paints and coatings, PPG Industries, has experienced raw material shortages and logistics logjams which prevented them from filling many customer orders in the second quarter.
- The fifth largest industrial distributor Fastenal can’t find enough employees to staff their retail branches, bottlenecking products, and services to market.
- Caterpillar, the world's largest construction machinery manufacturer, expects logjams and supply chain challenges to last through the end of the year. And the issues they’re facing are far broader than the one-off component or metal-casting shortages.
- Shortages in semiconductors are staggering Rockwell Automation’s sales growth.
- Industrial products conglomerate Dover Corporation can’t get the components they need to manufacture industrial refrigerators and garbage trucks.
- And Stanley/Black & Decker is having to pay additional transportation costs of about $80 million in the 3rd and 4th quarter to airfreight goods and lock in what ocean containers they can, just to keep up with demand, much less to attempt market growth.
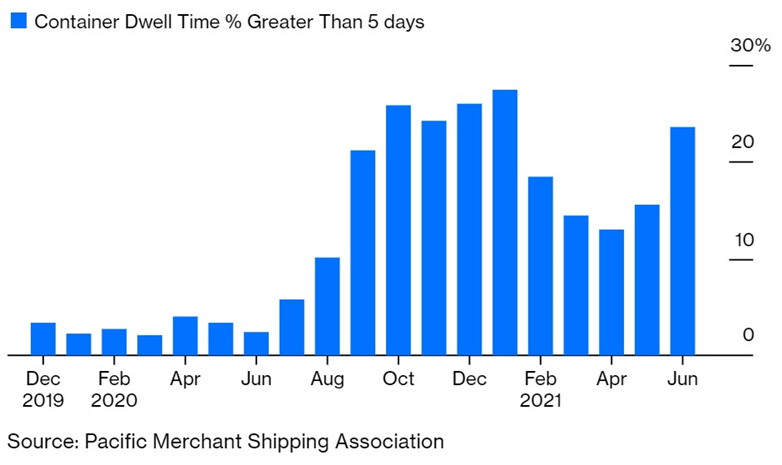
The strain has caused many companies to run low on stock of many items, forcing some to order parts from their competitors just to satisfy their own customers. The chart below illustrates the trends of freight bottlenecks over the past year.
Snowball Effect
Traditional approaches to logistics and supply chain networks which have been ingrained into much of the psyche of U.S. importers has allowed them to miss opportunities for geographic diversification and better preparedness. For instance, the expansion of the Panama Canal, which opened in 2016, allows vessels a 50% increase in capacity of up to 15,000 20-foot-equivalent units (TEUs). These larger capacity ships now have direct access to the Gulf and the East coasts of North and South America. The Panama Canal Authority also extended policies to promote traffic which included rebates trough a loyalty program for larger shipping companies. However, the impact of The Panama Spread has been felt throughout west-east trade routes due to spot rates practically doubling this summer.
Spot rates are the one-time fee that a shipper pays to move a load (or shipment) at current market pricing. The Freightos Baltic Exchange Daily Index (FBXD) measures the average spot rate from China to the west and east coasts of North America. The difference between the rates is referred to as Panama Spread (FBXD.PANA). The Panama spread rarely exceeds $1,500. However, in June due to the lingering effects of the pandemic, it was nearly doubled to $ 3,000. This is largely due to the fact that the west coast is nearly bursting at capacity. All of this has only created a snowball effect of adding to some of the congestion surcharges being tacked onto intermodal rail traffic coming out of Southern California.
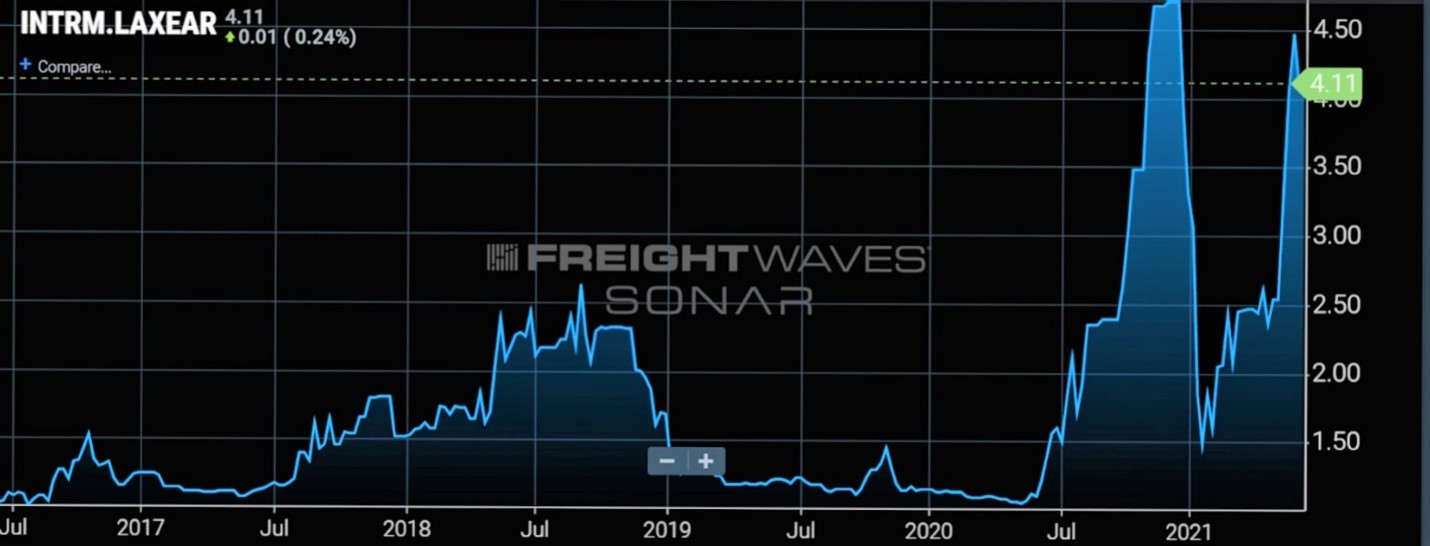
That’s not to mention overland intermodal spot rates from Los Angeles to New Jersey are also skyrocketing as seen in the chart below.
Recently, logistic managers are beginning to pay more attention to geography. Many companies are moving at least some of their production to Southeast Asia, particularly in Malaysia, Singapore, Vietnam, the Philippines, and China. They are either setting up wholly-owned subsidiaries or contracting with local manufacturers. Thus, ocean routes via the Suez Canal to America’s East coast ports are becoming much more competitive. Westbound from Singapore to New York through the Suez Canal can take as little as 25 days. Only 5 days longer than eastbound to Los Angeles and Long Beach. And Yantian in Shenzhen, China, is only 31 days westbound to the East coast via the Suez. Even though these westbound routes may be a few days longer, the benefits of increased throughput and reduced congestion at Eastern ports can be much more cost effective. When considering delays in sea and rail congestion in Southern California the eastern port accessibility to the Ohio Valley and Midwest is making the Suez route very competitive. With 147.5 million Americans, almost half the U.S. population, living within 500 miles of Columbus, Ohio the proximity of eastern ports is invaluable under current conditions.
The international importance of the Suez canal cannot go understated. Opening in November 1869 and continuing to be the most direct seagoing trade route between Asia and Europe the Suez is the most important canal in the world, especially today. Over $1 trillion USD worth of goods and approximately 30 % of all global container traffic passes through the canal each year. Where the Panama Canal saw 475 million tons of cargo through its waters this last year, the Suez carried more than 1 billion tons.
Escalating shipping and freight costs directly impacts the costs of consumer and industrial goods. That’s why many companies are shifting their geographic footprint to accommodate local markets and putting more emphasis on reduced labor costs from the east.

Sources Include:
- AUTOBALA
- The TICO Times
- Deutsche Welle
- New Zealand Foreign Affairs & Trade
- Harvard Business Review
- FreightWaves
- Bloomberg
- MetalMiner®
- The Journal of Commerce